
Important Formulas in Sag and Tension Calculations
Sag and Tension Formulas for Overhead Power Lines
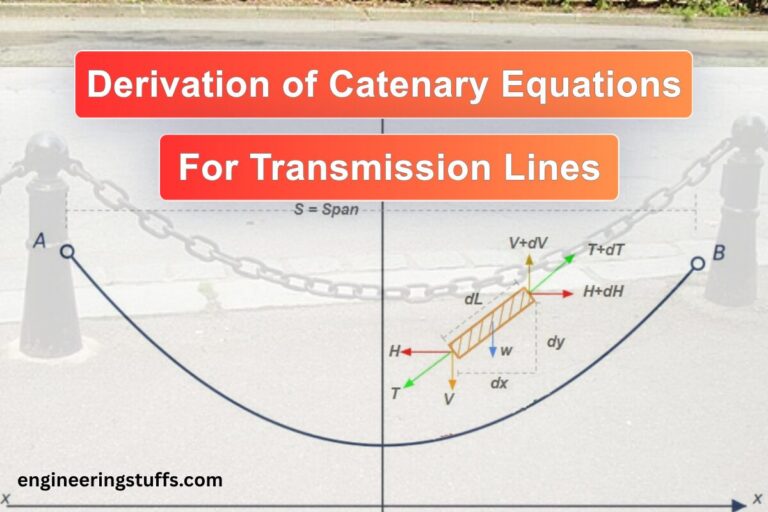
A working cheat sheet, organized by the question you actually show up with — not just a formula dump. Each section opens with the geometry, then answers the specific things that come up on a real job: sag at a point, conductor length, ice and wind, blowout, and which elongation model to trust. Notation matches the catenary derivation post: S = span, D = sag, L = conductor length, w = weight per unit length, H = horizontal tension, a = distance from support A.
| Conductor | Drake 795 kcmil 26/7 ACSR — total area 468.6 mm² (Al 402.8 mm², St 65.8 mm²), OD 28.1 mm, bare weight w = 15.97 N/m, RTS = 140.1 kN, final composite modulus E = 73.9 GPa (CIGRE TB 324, Table 13) |
| Base condition | S = 300 m level span, installed at H₁ = 25% RTS = 35,025 N at t₁ = 15°C |
| Inclined variant | Same span, supports differ in elevation by h = 10 m, used for Section 1–2 inclined-span questions |
| Loading variant | 12.5 mm radial ice, 380 Pa wind pressure, at t₂ = −10°C — used for Sections 3, 4, and 6 |
Every “Example” box below plugs into this same conductor and span, so results carry over between sections instead of resetting each time.
Catenary Curve
The exact shape a conductor takes under its own weight and tension. Everything else in this post — the parabola, the loading formulas, the elongation models — is either a simplification of this curve or something layered on top of it. Full derivation: The Role of Catenary Equations in Sag and Tension Calculations.
What is the catenary equation, and where does H/w come from?
Variables
H— horizontal component of conductor tension (N), constant along the spanw— conductor weight per unit length (N/m), wherew = mg;m= unit mass (kg/m),g= 9.81 m/s²x— horizontal distance from the vertex (m)y— height above the reference line (m) — not the sag; see the note below
y = H/w, not y = 0 — this is the single most common source of confusion when people first meet this formula. H/w is a scale constant of the curve (often called the catenary parameter), not sag. To get sag, you need the formulas below.How do I find sag in a level span?
Where’s the point of maximum sag on a level span?
Exactly at midspan (x = 0, a = S/2) — but only because the span is level. That stops being true the moment the supports sit at different elevations (see below).
How do I find the conductor length in a level span?
How do I find sag when the supports are at different elevations?
Two steps: locate the vertex first, then compute sag relative to the chord line A–B.
Variables
h— elevation of B above A (m); negative if B is lower
How do I find the conductor’s elevation at distance a from support A?
This is the number you actually want for a clearance check — height relative to support A, not the drop below the sloped chord.
Where does the vertex actually sit on an inclined span, and where is max sag really located?
| h (m) | Vertex, distance from A | Max-sag point, distance from A |
|---|---|---|
| 0 (level) | 150.0 m | 150.0 m |
| 10 | 77.0 m | 150.1 m |
| 20 | 4.0 m | 150.1 m |
What’s the tension at any point along the span, not just at the supports?
Useful because the highest tension in the span is always at the higher-elevation support attachment point — not at the vertex — which is the point you actually need to check against the conductor’s rated breaking strength.
Parabolic Approximation
The small-slope limit of the catenary — the shortcut most engineers actually reach for by hand. Same questions as Section 1, parabolic answers.
What’s the parabolic sag formula, and when is it accurate enough?
Valid when the slope stays small — governed by wS/H, i.e. long slack spans and low tension push you toward the exact catenary; short, taut, everyday transmission spans are usually well inside where the parabola is fine. See the worked error check below for how “fine” scales with span length.
How do I find sag in a level span (parabola)?
How do I find the length of cable in a level span (parabola)?
How do I find sag at distance a from support A (parabola)?
How do I find the elevation at distance a from A, relative to A (parabola)?
Where’s the vertex on an inclined span (parabola)?
This is the small-slope limit of the exact vertex formula in Section 1 — matches it closely for typical spans, diverges more as h/S grows (see the worked check in Section 1).
How much error does the parabola actually introduce?
| Span | Catenary D | Parabola D | Abs. error | % error |
|---|---|---|---|---|
| 400 m | 17.35 m | 17.31 m | 0.043 m | 0.25% |
| 800 m | 69.92 m | 69.23 m | 0.694 m | 1.00% |
Effects of Ice and Wind
Ice and wind don’t change the shape of the formulas — they change what you plug in for w. Everything from Sections 1–2 still applies once you’ve built the combined load.
How does ice change the effective conductor weight?
Variables
d_c— conductor outside diameter (m)t— radial ice thickness (m)ρ_ice— ice density, typically 900 kg/m³ (NESC / CIGRE)g— 9.81 m/s²
How does wind load combine with weight and ice?
Variables
P_wind— wind pressure (N/m²)
How do I get sag under combined ice + wind loading?
How are ice and wind loading values actually chosen for a real design?
Briefly: from loading district maps and combined-loading cases (NESC) or the equivalent CIGRE TB 324 approach — not derived from first principles per project. That’s a big enough topic to live on its own; see this site’s NESC 2017 loading posts for the full treatment rather than repeating it here.
Vertical, Horizontal & Slant Sag
Wind doesn’t just increase sag — it rotates the plane the conductor hangs in. That rotation is why one sag number isn’t enough once wind is in the picture.
What’s the difference between these three, and why do you need all of them?
D— slant (total) sag, along the direction of the resultant load w_total. This is what the loaded catenary/parabola formula gives you directly.D_v— vertical sag, the drop straight down. This is what matters for ground clearance.D_h— horizontal blowout, the sideways displacement. This is what matters for clearance to the structure, to adjacent phases, or to anything beside the line.
What’s the blowout angle θ?
How do I compute vertical sag?
How do I compute horizontal blowout?
Linear, SPE & EPE — Sag After Stringing
The catenary and parabola formulas above assume a fixed w and a fixed unstressed conductor length. Neither stays fixed over the life of a line — temperature changes elastically, and the conductor itself permanently stretches. These three models are the standard ways of tracking that stretch (CIGRE TB 324 terminology).
Why can’t the catenary/parabola formulas alone handle a condition change after stringing?
Those formulas take H and w as given and return a shape. They don’t tell you what the new H is once temperature or load changes the conductor’s unstressed length. That’s a separate problem — solved by an elongation model plus the conductor state change equation in Section 6 — not something the catenary equation itself handles.
What is Linear Elongation (LE), and when is it good enough?
Treats the conductor as a single, purely elastic material — one E, one α — for its entire service life. Ignores permanent (plastic) stretch entirely, which means it always overstates final tension and understates how much sag will grow over time. Fine for preliminary sizing or low-consequence short lines; not something to trust for a final sag-tension table.
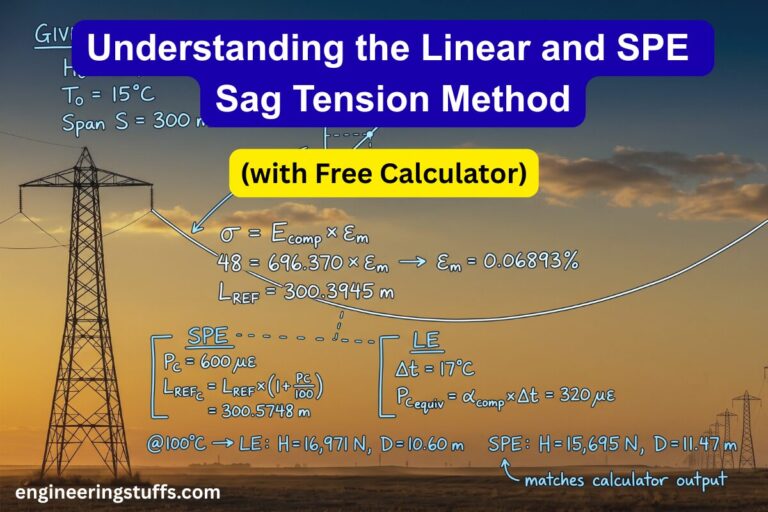
What is SPE (Simplified Plastic Elongation)?
Same elastic backbone as LE, but with a single fixed, typical permanent-elongation offset added on top — based on historical experience for that conductor family, not on the specific loading event or time in service. It’s the practical middle ground, and what most hand and spreadsheet sag-tension calculations actually use.
What is EPE (Experimental Plastic Elongation)?
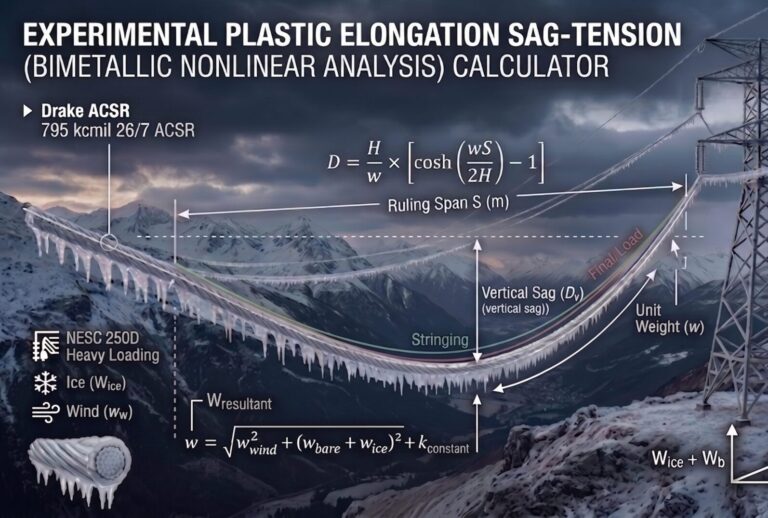
Uses the conductor’s actual measured non-linear stress-strain curve, tracking plastic elongation as a function of the real loading history — the specific design ice/wind event — separately from time-based metallurgical creep, rather than one blanket allowance. Most accurate, most data-hungry (needs manufacturer/lab curves); this is the model behind this site’s EPE calculator and behind SAG10-class software.
Which one should you actually reach for?
- Preliminary or rough sizing, no data on hand → LE
- Everyday design work, standard conductor, no lab curve → SPE
- Final design, critical or high-voltage lines, or initial-vs-final sag really matters → EPE
Worked examples: Linear and SPE Sag Tension Calculator and the EPE Sag and Tension Calculator.
Stringing States & the Conductor State Change Equation
A full sag-tension table is really just this equation solved repeatedly — once per loading case, and once more to move from “initial” to “final.”
What do initial, final-after-load, and final-after-creep actually mean?
- Initial — the state right after stringing, sagging, and clipping. Reference condition; essentially no permanent stretch yet.
- Final-after-load — the state after the conductor has experienced its worst design loading event (max ice + wind) at least once. Captures the permanent stretch that event induces — happens fast, not gradually.
- Final-after-creep — the state after a specified sustained period, commonly 10 years, at everyday tension and temperature. Captures metallurgical creep — slow, continuous, and a separate mechanism from load-induced stretch (Section 7).
How do I get the effective modulus of elasticity and thermal expansion for a composite (ACSR) conductor?
Needed as inputs before you can run the state change equation below.
Variables
E_al, E_st— modulus of elasticity of aluminum and steel (Pa)A_al, A_st, A_total— cross-sectional areas of aluminum, steel, and total (m²)α_al, α_st— coefficient of linear thermal expansion of aluminum and steel (/°C)
How do I find the change in conductor length from tension or temperature alone?
Why does tension drop over time even with no load change?
Creep — a slow, continuous, permanent stretch under sustained stress that keeps happening even at everyday, unremarkable tension. As the unstressed length grows, the same span settles into more sag at lower tension for the same temperature. Full explanation in Section 7.
When do you actually need the conductor state change equation, and what does it solve for?
Any time you know the conductor’s state at one condition (H₁ at temperature t₁, weight w₁) and need the tension H₂ at a different condition — different temperature, different ice/wind load, or a different unstressed length after permanent stretch. Both tension and temperature changing together, plus a possible permanent-elongation offset, is exactly what the two length-change formulas above can’t handle separately — this equation solves all of it at once.
Variables
H₁— initial conductor tension, at the initial (reference) condition (N)w₁, w₂— unit weight of conductor at the initial and final conditions (N/m)Δt = t₂ − t₁— temperature change (°C)A, E, α— cross-sectional area, modulus, and thermal coefficient (final/composite values)S— ruling span, or single span length (m)
Solved once per row of a full sag-tension table (from a known reference state to each loading case), and again to move from “initial” to “final” — where the permanent-elongation offset comes from either SPE’s fixed value or EPE’s stress-strain-derived value.
What are the limitations of the conductor state change equation?
- Linear-elastic only. It assumes a single, constant composite E over the whole range from state 1 to state 2. It has no idea about plastic or creep elongation on its own — that has to be fed in externally as a permanent-elongation offset from SPE or EPE (Section 5). Run it alone and you’ve implicitly assumed the LE model.
- Assumes the conductor stays in tension throughout. Near or above the knee-point temperature, the aluminum layers of an ACSR conductor can go slack and the steel core alone carries the load — a real, documented behavior (Section 7) this equation doesn’t see coming.
- Built on the parabolic length approximation, not the exact catenary — the
(wS)²/24H²term is the same series term from Section 2. Same error behavior: negligible on typical taut transmission spans, growing on long or slack ones. - A, E, and α are treated as constants — real conductor stiffness and thermal behavior shift with stress and temperature, most noticeably for non-homogeneous ACSR near the knee point.
- Solved per ruling span, not per physical span. It gives you one tension assumed common across a whole line section — actual tension in each individual suspension span can differ slightly from that.
- The cubic can have more than one positive real root for some input combinations. You still need engineering judgment — usually “closest to H₁” or “within a sane %RTS range” — to pick the physical one.
How do you actually solve the conductor state change equation?
By hand, this cubic is almost never solved with the general cubic formula (Cardano’s) — it’s solved iteratively. Two practical routes, both standard practice:
- Newton-Raphson iteration — fast, reliable, and what most sag-tension spreadsheets do under the hood (including a plain Excel Goal Seek / Solver call). Start from H₂ = H₁ as the first guess.
- Graphical method — plot the loaded catenary curve and the elastic-modulus line on a stress-strain diagram and read off their intersection. This is the classic Varney/Alcoa technique, and it’s literally what the stress-strain picture in Section 5 is showing.
| Iteration | H_n (N) | H_(n+1) (N) |
|---|---|---|
| 0 | 35,025 | 116,476 |
| 1 | 116,476 | 85,752 |
| 2 | 85,752 | 70,161 |
| 3 | 70,161 | 65,487 |
| 4 | 65,487 | 65,076 |
| 5 | 65,076 | 65,073 |
How does this connect to ruling span?
The state change equation — and the whole sag-tension table — is solved using the ruling span, not each individual physical span, since tension is assumed common across all suspension spans in a section. See What is Ruling Span? and the step-by-step ruling span computation post.
Creep
The mechanism behind “final-after-creep” in Section 6 — worth its own section because it’s easy to under-account for.
What is creep, physically, and how is it different from elastic strain?
Creep is slow, continuous, permanent (non-recoverable) elongation of a material under sustained stress — distinct from elastic strain, which fully recovers when the load is removed. In ACSR, creep occurs almost entirely in the aluminum strands; the steel core creeps negligibly. That’s why, as a conductor ages, the steel core picks up a growing share of total tension while the aluminum layers “give.” Most creep happens in the first days to weeks after stringing, continuing at a decreasing rate for the rest of the line’s service life.
How is it normally handled in a sag-tension design?
Captured through the “final-after-creep” condition — commonly evaluated at 10 years — from either a typical creep allowance (SPE) or lab-measured long-term creep curves (EPE), folded into the state change equation as an equivalent permanent elongation or equivalent temperature shift.
Why does skipping it cause real problems years after construction?
Ignoring creep means your “final” condition is really still your initial one — sag will be under-predicted, and clearance that looked fine on paper can erode over the years as the line actually settles into more sag than the initial calculation showed. The opposite mistake is just as real: over-tightening a conductor at stringing to try to compensate for expected creep, without properly modeling it, risks over-tensioning before creep ever gets the chance to relax it. See Transmission Line Failure Due to Increase in Conductor Tension for a worked case of that second failure mode.